2 Girls, one Bike.
Click the URL, embed isn’t working.
SFW I swear.
or:
http://www.fandome.com/video/114675/2-Girls-1-Bike/?q=c
Click the URL, embed isn’t working.
SFW I swear.
or:
http://www.fandome.com/video/114675/2-Girls-1-Bike/?q=c
In continuation of the NY vs. Boston cycling thing, I’d like to offer a hypothesis about Bostonian cycling.
Specifically, how Somerville, Cambridge and Boston have more interest in Cycling than New York. Boston was once the worst biking city in the world, why would we spend more time reading about it on the internet?
Yes, Boston proper is horrible for biking, but it is flanked my pleasant areas like Somerville, Cambridge and Brookline. This creates a safe harbor – a kind womb, for neophytes and n00bs. This is coupled with a natural selection against bikers in Boston proper, so that there is a reduction in the more casual biker. Yes, casual riders exist and clog up the bike path, but most bikers in Boston are curious and motivated to learn about biking. This creates a core of interested, intelligent, and dedicated bikers, around which a culture can form.

Figure 1 illustrates an awesome bike, whose image was stolen from the fixed gear gallery.
So, in short. I’m saying we have less casual riders. The would-be casual riders are forced by the difficult environment into either progressively more proficient cyclists, or pedestrians. Our percentage numbers might be less than another city, but those that remain are the tough, the savvy, and fast.
Or, in Graph Form, here is what I’m saying. 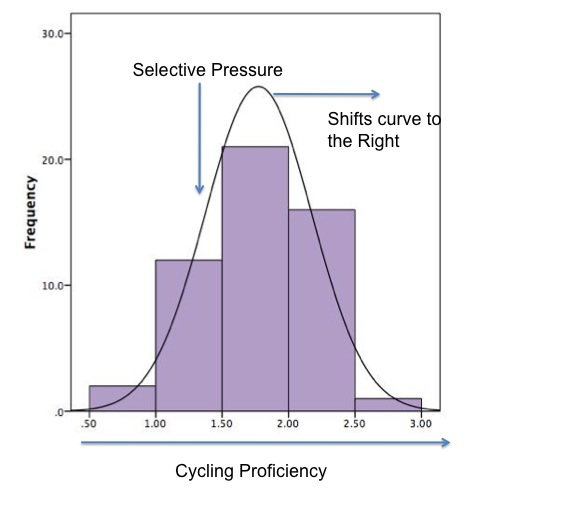 Note: these are not real numbers. I have not quantified cycling proficiency, nor have I established the frequency of such a train within the Bostonian people.
Comments Off on Natural Selection, and Wombs
I hear a lot of crap these days coming from my Friends who moved to New York after college.
I know your city is bigger. I know you have more museums. I know it’s more expensive and they have jobs that pay better.
Until now, I’ve been conceding the “cyclist city” point, but I might have to re-think that:
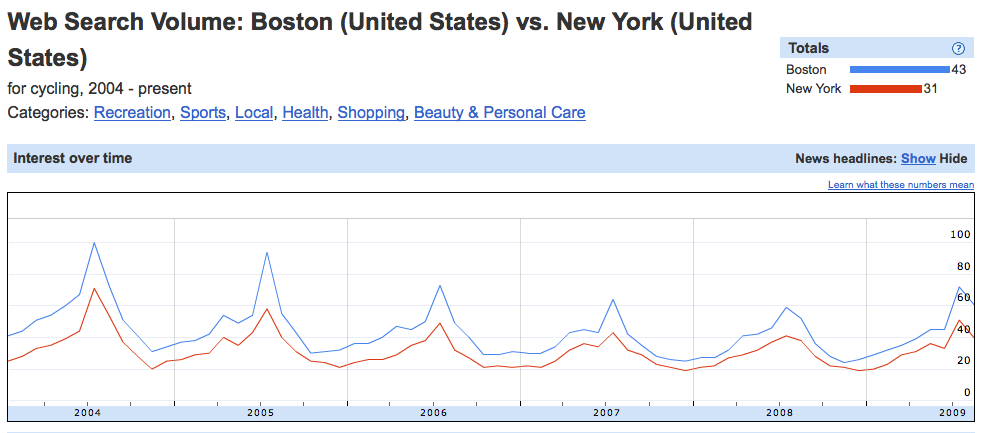
It seems Bostonians express more interest in Cycling than New York does. So, now I can tell my friends to eat a dick.
But Boston is made up of so many little hamlets and cities, you might say. Which of them all is the most cycling-curious?
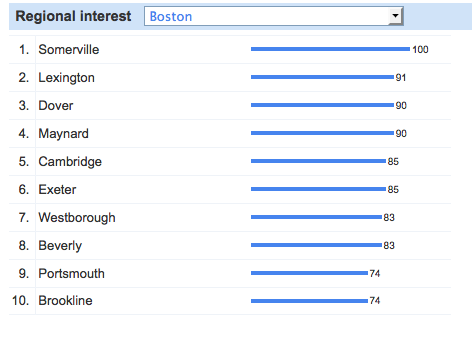
Why, it is Somerville. Thanks Mayor Joe Curtatone!
Comments Off on Boston vs. New York
As an update from my previous Post, I’d like to first make a compariston, using the more advanced google insight. Below is a graph of cycling searches, with a relative search index number on the right. FYI, higher numbers mean more searches, but don’t necessarily denote a specific number of “googles”.
The graph shows a general trend toward a decrease in “cycling” googles, but then I looked at the yearly averages: 
Yes, that’s right. 2009 showed a slight increase! We’re actually above the 2007 numbers, but not quite at 2006 numbers.
So, this could mean two things:
1) A decrease in the world’s interest in cycling
2) A saturation of knowledge in cycling, which is now reaching equilibrium
3) A possible upswing in cycling interest? That remains to be seen, but MAYBE.
And before anyone gets on my case for using this ridiculous measure, Google is using this to measure the fucking flu.
That’s right. Google is assuming that more people google Flu-related things during flu season and that this is indicative of Flu prevalence. We’ll see how that turns out.
Comments Off on Update on Cycling Trends
I love Google Trends, and today I was looking for some cycling related things. One thing lead to another and I found this:
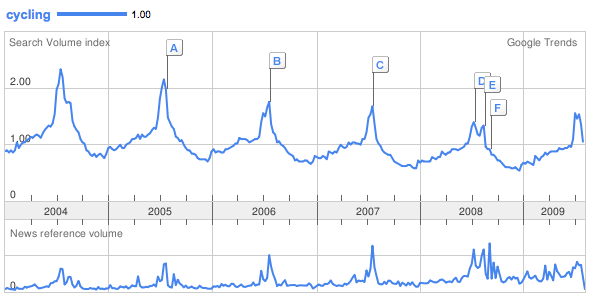
Yes, the number of Google searches for “cycling” is decreasing yearly, as the number of news articles (bottom of figure) is increasing. I’m not sure what this means.
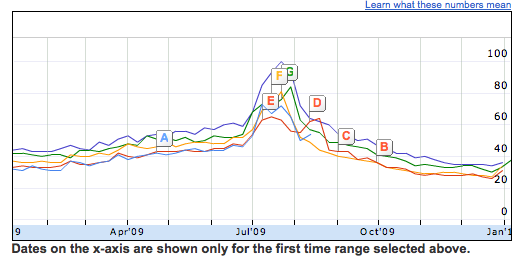
If you’re curious about the peaks throughout the graph, here is a detail shot for 2008:
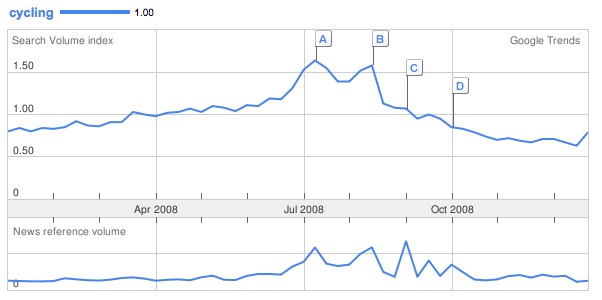
I’m pretty sure you can guess what causes people to Google “cycling” during this 20ish day period around July. It rhymes with Blour de Pants.
And yes, the trend is there for “Biking” as well.
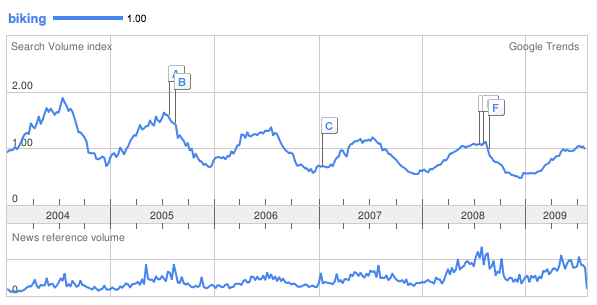
I’d guess that the peaks are not quite as high for “biking” because most of the world calls the sport “cycling”. So couple that fact with the fact that the Tour is more popular over seas, and you get an attenuated “biking” peak around the Blour de Pants time. I’m sure that this peak also reflects summer and good times in the sun as well.
Comments Off on Google Trends
So I was checking out this site: http://stolenbikesboston.blogspot.com/ and I noticed some comments remarking on the number of mountain bikes that were stolen. So I checked it out.
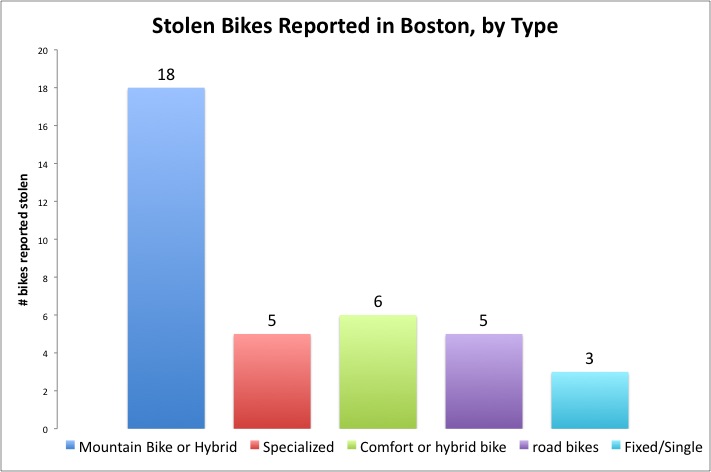
I had a little trouble with the “Hybrid” bikes, since some are like shitty mountain bikes, and others are like shitty comfort bikes. I decided to group Hybrids with “comfort” bikes, because some of the photos of Hybrids were actually comfort bikes. Since this is self report, there is an amount of error that can be attributed to the inexperienced rider.
Which is probably why mountain bikes are getting stolen. I’m going to go out on a limb and say biking n00bs are attracted to bikes with shocks and so buy more mountain bike. That generalization arrow shouldn’t be confused for the one running in the opposite direction. Mountain bikers are not all n00bs; rather, most n00bs are mountain bikers. This is reflected in the bikes being stolen.
It is notable that there were very few classic bikes, or expensive road bikes. The single/fixed gears stolen were of a basic variety (eg: a redline, a Raleigh conversion). This leads me to think that the predominant factor in WHY a bike is stolen is the quality of the lock.
There is a special category for the “specialized” bikes, the breakdown is as follows:
2 Specialized Allex, 1 Dolce, 1 Hard Rock, and 1 “Mountain Bike” (owner might not have known the model).
This category does not overlap with any of the other categories.
In summary: Dear Mountain bikers. Buy a U-lock.
Comments Off on Stolen Bikes in Boston, by type.
So i found this on Digg just now. It’s a comic that features “Bike Monsters”, which was clearly a theme fueled by the artist’s difficulties with the human form.
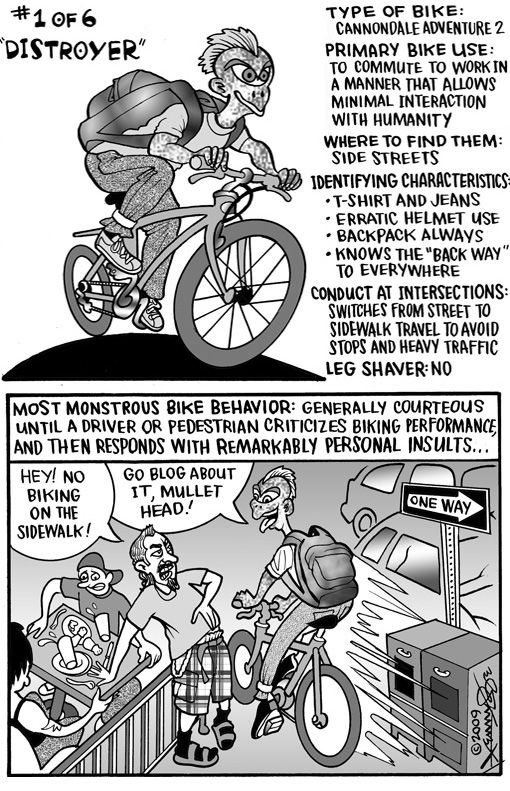
You can see more at the link below, which is owned by a blogger in Denver.
http://blogs.westword.com/latestword/2009/06/kenny_bes_guide_to_summers_ter_1.php
I like the third comment down, which reads:
Wow…not even remotely funny. Now all the bicyclists in Denver are put in more danger than we were before…thanks for nothing and for dehumanizing cyclists so that hateful and mentally unhinged motorists will have less regard for human beings riding bicycles–we are NOT BUGS to be squashed. Beware, Mr. Kenny, the bad karma you have unleashed might well come back to bite you!”
I’m inclined to agree. Bikers suffer from a lot of bad PR, and it would be nice if someone recognized that we are typically the losers in the Car vs. Biker crash.
In any case, I’m not sure how applicable this is to Boston and I’m pretty sure that the author behind this comic is not a biker. One of these factors might have played a role in drawing the fixed gear rider with a loose computer bag, rather than a messenger bag.

It’s kind of weird how the Fixed gear rider goes from a human in panel one to an elf in panel two. If you’re curious why the Fixed gear rider looks like an elf, it’s because all of the bikers are “Monster Themed”. Fixie rhymes with Pixie – and presumably the artist thought that wings would look dumb. And so, Pixie minus wings = elf.
He’s also a giant in panel one, and normal sized in panel two. Perhaps when Giants mutate into pixies, the result is a wingless pixie, which resembles a Keebler Elf.
I’m also kind of surprised that there were no student riders. Isn’t there some homologue to the BU student with a rusted Hybrid Huffy? I guess that might be the cannondale monster, who bikes on the sidewalk.
I’ve never really seen this guy, ever:

Who goes out in a jersey and army pants? I’ve honestly never seen it. Is this a Denver thing? Before you think this is Denver’s version of the “Full Kit”style racers, there is a separate category for those guys, which I believe most are familiar with. I guess the army pants guy is sort of the poor man’s Full Kit.
Personally, I’d like a more accurate taxonomy of bikers. Perhaps even one portraying them as humans.
Comments Off on Bike Monsters
We, the biking community, are associated with reduced motor vehicle fatalities.
Attractive and Convincing Graph:
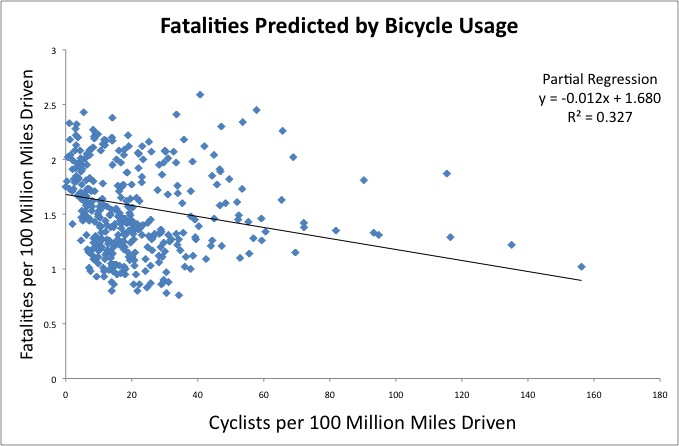
Boring Technical Note: This attractive and convincing graph is an approximation of a partial regression. Since it’s damned difficult to graph 2 variables while controlling for a third, I just decided to divide both variables by the third variable (Mmiles). With the partial regression, you actually get an intercept of .832, but since my third variable is not 0, we can’t use that -so I approximated one that looked good. The actual stepwise regression formula is y=.832+1.68x-.012y, where x=millions of miles, and y=numbers of cyclists.
Simple version: More bikers = Less Motor Vehicle Fatalities.
Complicated Stuff:
A partial negative correlation was found between the number of motor vehicle accidents and the number of workers who report cycling to work. This is basically a correlation between my previous post and the post about motor vehicle fatalities. The correlation was significant, using a partial correlation that controlled for 100 milion miles driven per state, r(354)=-.438, p<.001.
This basically means that an increase in cyclists is associated with having fewer motor vehicle accidents, after controlling for the number of miles driven.
It is important to point out that this r value is compiled of every state data for years 2001 to 2007. So, Massachusetts would have 7 data points for bike stats, correlated with 7 points for fatalities. If the years are treated independently, each correlation is also significant to at least p<.02, with an r no greater than -0.32 and no less than -0.52.
Caveats!
Correlation is not causality. But there is a definitely an inverse association between the number of bikers commuting to work and the number of motor vehicle fatalities.
I promised an analysis of Bikers throughout the ages, and here it is. I went to the US census, and put together an excel file for 2001 to 2007, plugged those numbers into SPSS, graphed it and ran a repeated measures ANOVA.
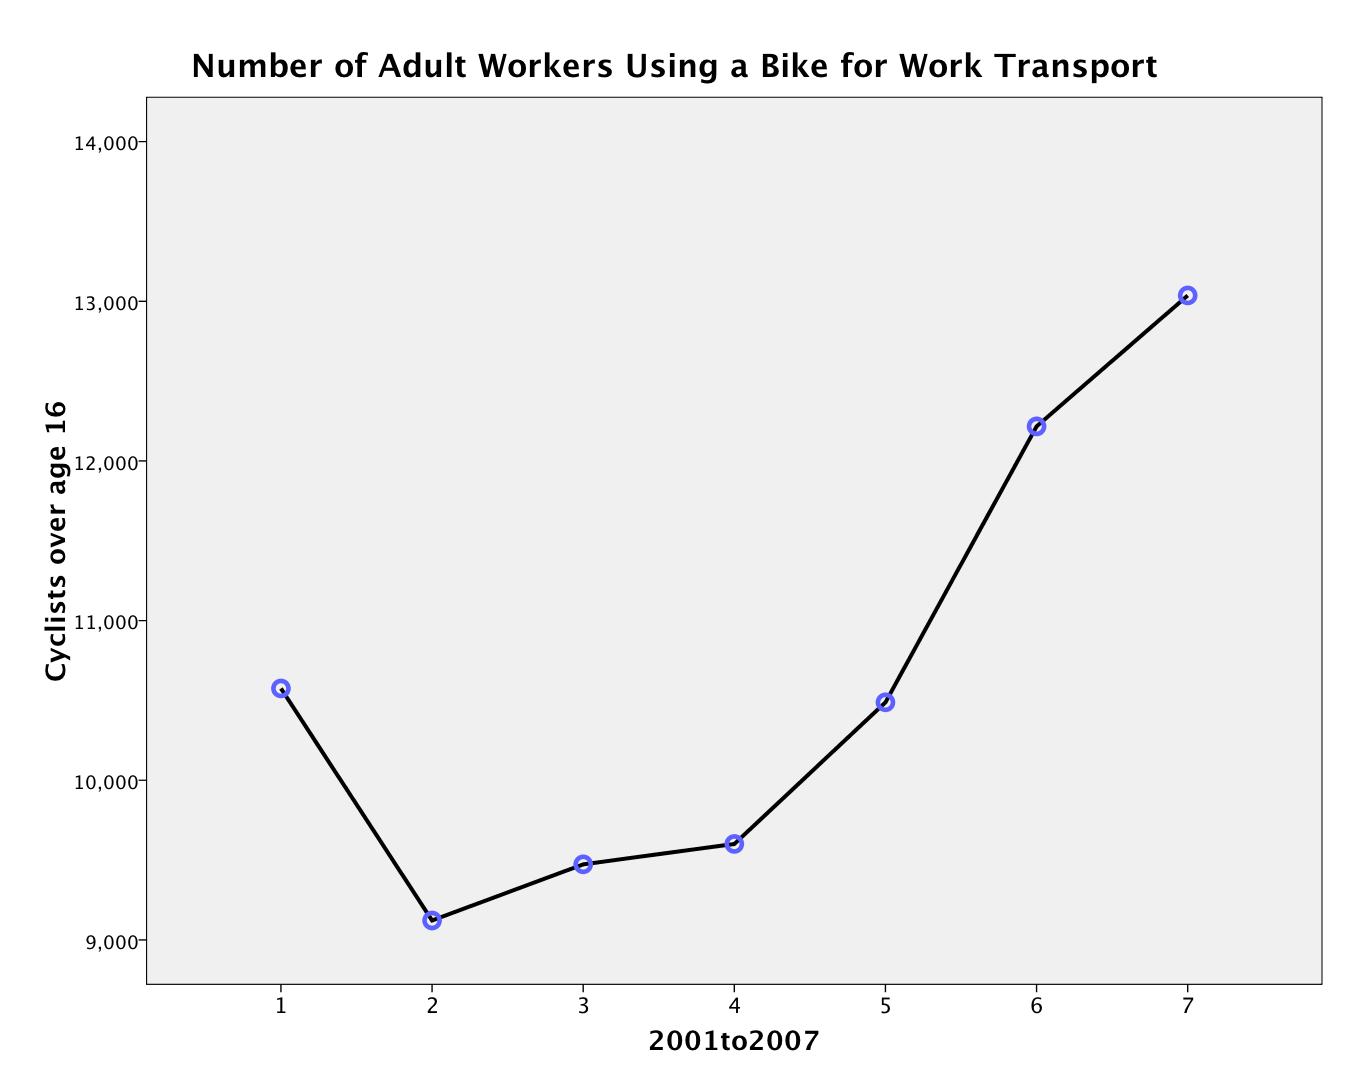
This change in the number of Bike-commuters is statistically significant at F(1.751, 87.55)=12.891, p<.001.
One big difference between this graph and the number of car accidents is that there are far more car accidents than cyclists, and the change in cyclists is rather modest, compared to the US population of 300million. However,the effect size, measured by partial eta squared is rather large at .205 – for reference you should pay attention to any partial eta of .09 or greater.
In Least Significant Difference (LSD) pairwise comparisons, years 2005, 2006, 2007, all represent significant rises from all previous years. The exception is that 2005 was not significantly different from 2001. Years 2002, 2003, 2004, did not significantly differ from one another.
Note: The extremely low numbers here seem kind of strange. To put this in perspective, this is roughly 2 bikers for every Starbucks store in the US Starbucks Facts. However, what I have graphed here is the state-average. The statistical significance is for the USA stately average over time. For instance California has roughly 100,000-144,000 bike commuters and Arkansas had between 800 to 1400.
What these results mean is that, taking into account state-wide variation, there was a statistically significant change in the number of bikers, on average, for the entire united states.
All data were harvested with vigor from the US census community survey:
http://factfinder.census.gov/servlet/DatasetMainPageServlet?_program=ACS&_submenuId=&_lang=en&_ts=
Comments Off on Cyclist Commuters from 2001 to 2007
I often fantasize about a car-less existence. Not just for me, but for my community, and now some German town has made that a reality. I heard that rumor about closing down parts of Newbury St. to car traffic, which I think is excellent, but I think this should be implemented on a wider scale. I’d love to see Harvard square closed to traffic, or any other pedestrian-and-car-heavy area.
In any case, here’s the link.
http://www.nytimes.com/2009/05/12/science/earth/12suburb.html
Also, there is a great slide show: http://www.nytimes.com/slideshow/2009/05/12/science/20090512-SUBURB_index.html
Comments Off on NYtimes Article


 1 Comment