Cyclist Commuters from 2001 to 2007
I promised an analysis of Bikers throughout the ages, and here it is. I went to the US census, and put together an excel file for 2001 to 2007, plugged those numbers into SPSS, graphed it and ran a repeated measures ANOVA.
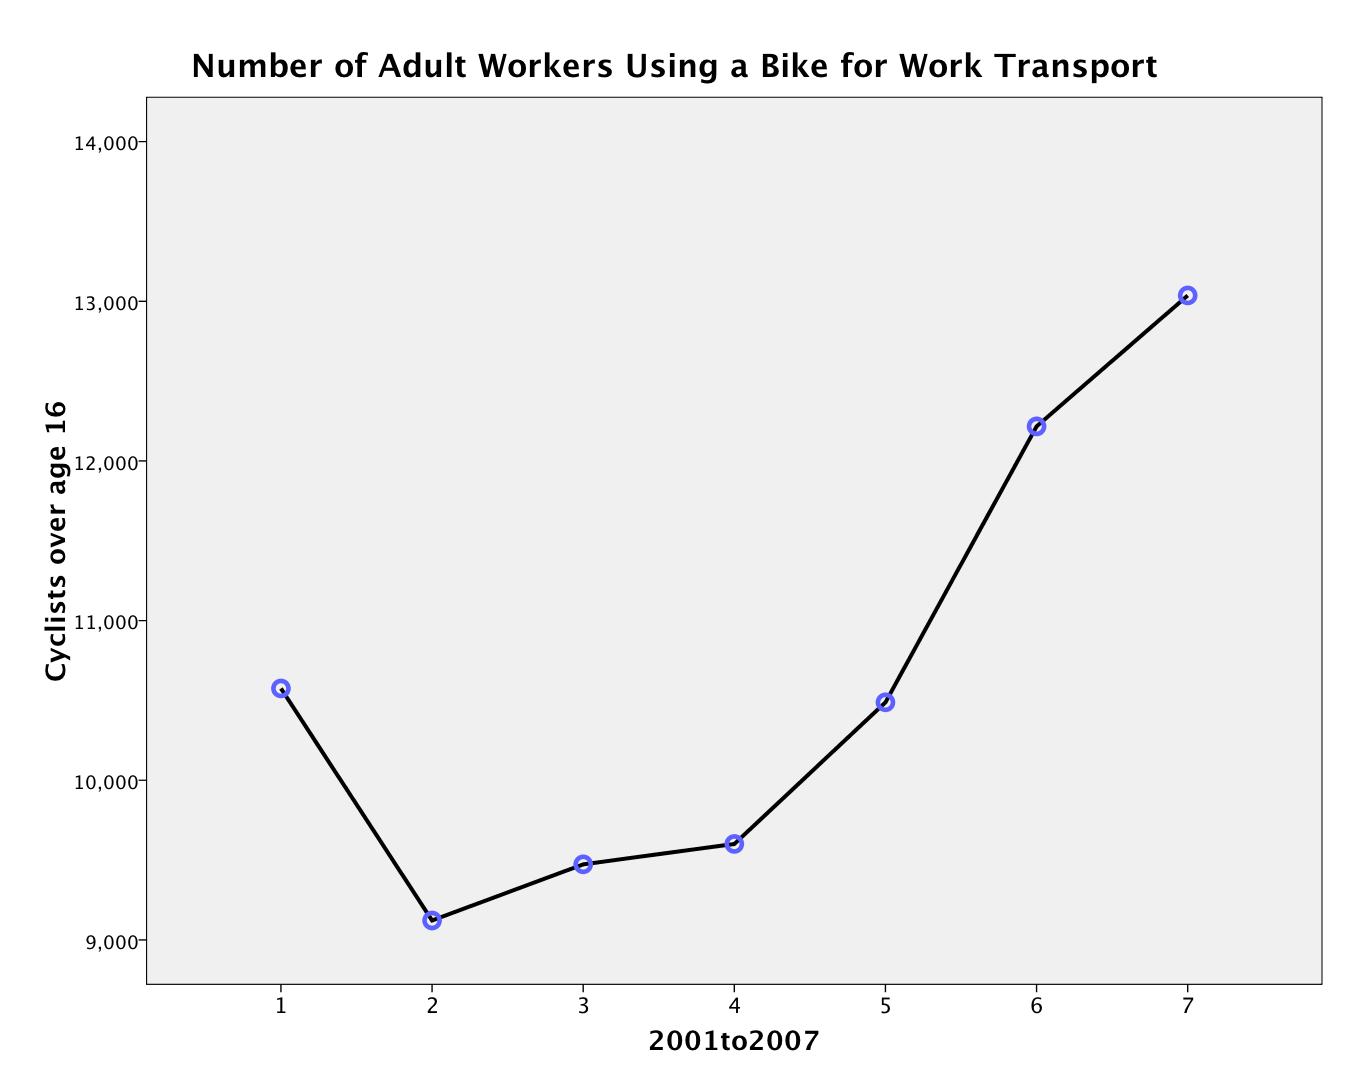
This change in the number of Bike-commuters is statistically significant at F(1.751, 87.55)=12.891, p<.001.
One big difference between this graph and the number of car accidents is that there are far more car accidents than cyclists, and the change in cyclists is rather modest, compared to the US population of 300million. However,the effect size, measured by partial eta squared is rather large at .205 – for reference you should pay attention to any partial eta of .09 or greater.
In Least Significant Difference (LSD) pairwise comparisons, years 2005, 2006, 2007, all represent significant rises from all previous years. The exception is that 2005 was not significantly different from 2001. Years 2002, 2003, 2004, did not significantly differ from one another.
Note: The extremely low numbers here seem kind of strange. To put this in perspective, this is roughly 2 bikers for every Starbucks store in the US Starbucks Facts. However, what I have graphed here is the state-average. The statistical significance is for the USA stately average over time. For instance California has roughly 100,000-144,000 bike commuters and Arkansas had between 800 to 1400.
What these results mean is that, taking into account state-wide variation, there was a statistically significant change in the number of bikers, on average, for the entire united states.
All data were harvested with vigor from the US census community survey:
http://factfinder.census.gov/servlet/DatasetMainPageServlet?_program=ACS&_submenuId=&_lang=en&_ts=
Comments Off on Cyclist Commuters from 2001 to 2007

