Saving Lives with Partial Correlations

We, the biking community, are associated with reduced motor vehicle fatalities.

Attractive and Convincing Graph:

partialcorr.jpg

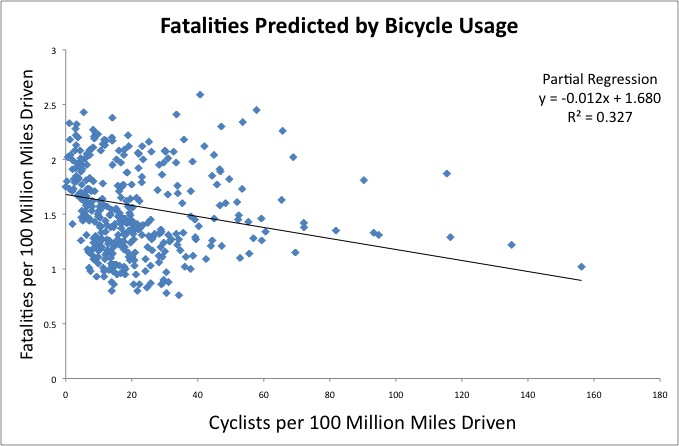
Boring Technical Note: This attractive and convincing graph is an approximation of a partial regression. Since it’s damned difficult to graph 2 variables while controlling for a third, I just decided to divide both variables by the third variable (Mmiles). With the partial regression, you actually get an intercept of .832, but since my third variable is not 0, we can’t use that -so I approximated one that looked good. The actual stepwise regression formula is y=.832+1.68x-.012y, where x=millions of miles, and y=numbers of cyclists.

Simple version: More bikers = Less Motor Vehicle Fatalities.

Complicated Stuff:

A partial negative correlation was found between the number of motor vehicle accidents and the number of workers who report cycling to work. This is basically a correlation between my previous post and the post about motor vehicle fatalities. The correlation was significant, using a partial correlation that controlled for 100 milion miles driven per state, r(354)=-.438, p<.001.

This basically means that an increase in cyclists is associated with having fewer motor vehicle accidents, after controlling for the number of miles driven.

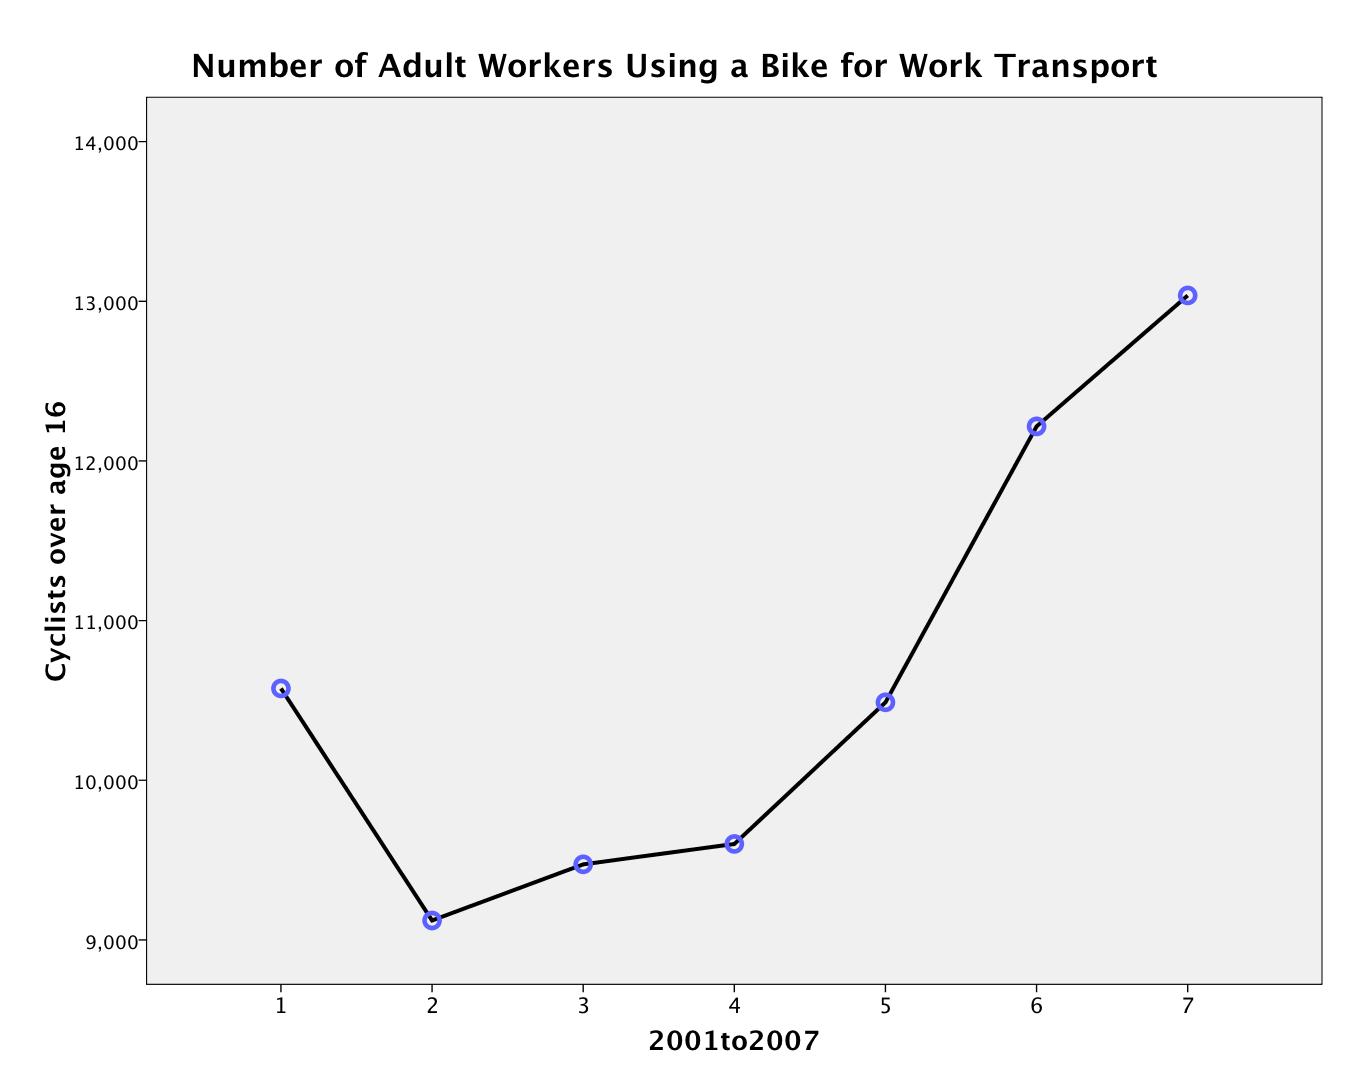
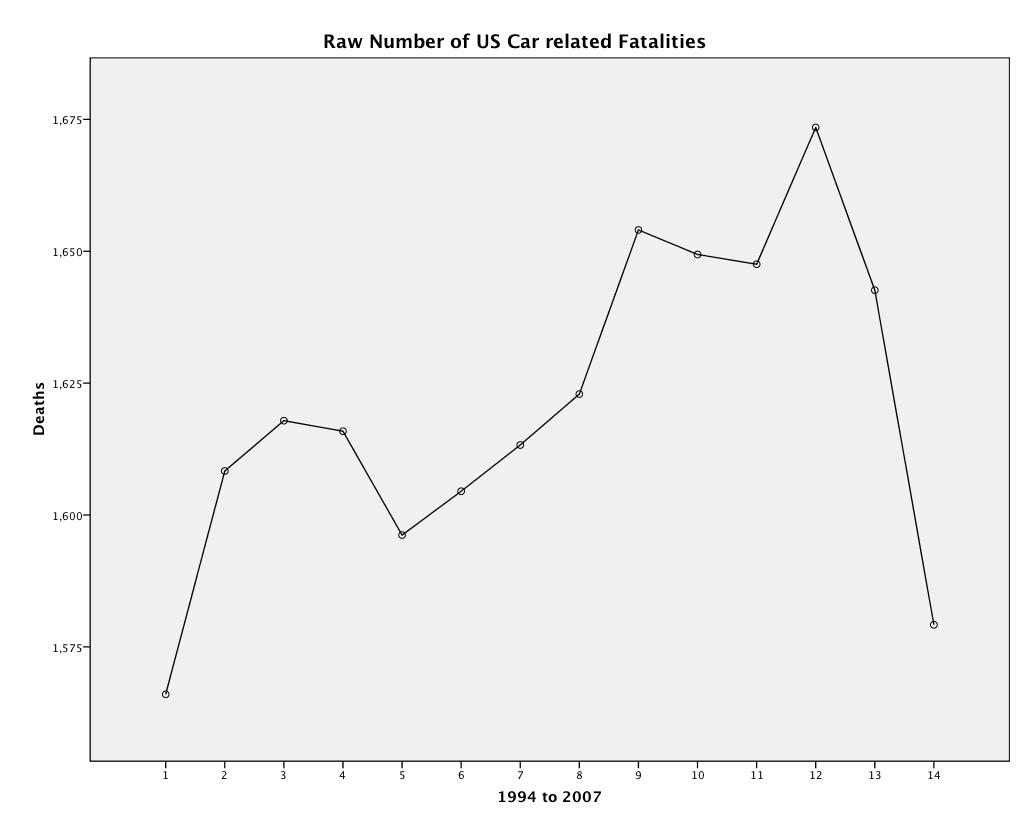
It is important to point out that this r value is compiled of every state data for years 2001 to 2007. So, Massachusetts would have 7 data points for bike stats, correlated with 7 points for fatalities. If the years are treated independently, each correlation is also significant to at least p<.02, with an r no greater than -0.32 and no less than -0.52.

Caveats!

Correlation is not causality. But there is a definitely an inverse association between the number of bikers commuting to work and the number of motor vehicle fatalities.

Cyclist Commuters from 2001 to 2007

I promised an analysis of Bikers throughout the ages, and here it is. I went to the US census, and put together an excel file for 2001 to 2007, plugged those numbers into SPSS, graphed it and ran a repeated measures ANOVA.

Bicycle as Primary Work Transport

This change in the number of Bike-commuters is statistically significant at F(1.751, 87.55)=12.891, p<.001.

One big difference between this graph and the number of car accidents is that there are far more car accidents than cyclists, and the change in cyclists is rather modest, compared to the US population of 300million. However,the effect size, measured by partial eta squared is rather large at .205 – for reference you should pay attention to any partial eta of .09 or greater.

In Least Significant Difference (LSD) pairwise comparisons, years 2005, 2006, 2007,  all represent significant rises from all previous years. The exception is that 2005 was not significantly different from 2001. Years 2002, 2003, 2004, did not significantly differ from one another.

Note: The extremely low numbers here seem kind of strange. To put this in perspective, this is roughly 2 bikers for every Starbucks store in the US Starbucks Facts. However, what I have graphed here is the state-average. The statistical significance is for the USA stately average over time. For instance California has roughly 100,000-144,000 bike commuters and Arkansas had between 800 to 1400.

What these results mean is that, taking into account state-wide variation, there was a statistically significant change in the number of bikers, on average, for the entire united states.

All data were harvested with vigor from the US census community survey:

http://factfinder.census.gov/servlet/DatasetMainPageServlet?_program=ACS&_submenuId=&_lang=en&_ts=

NYtimes Article

I often fantasize about a car-less existence. Not just for me, but for my community, and now some German town has made that a reality. I heard that rumor about closing down parts of Newbury St. to car traffic, which I think is excellent, but I think this should be implemented on a wider scale. I’d love to see Harvard square closed to traffic, or any other pedestrian-and-car-heavy area.

In any case, here’s the link.

http://www.nytimes.com/2009/05/12/science/earth/12suburb.html

Also, there is a great slide show: http://www.nytimes.com/slideshow/2009/05/12/science/20090512-SUBURB_index.html

U.S. Car Crashes over the years

 So, I was screwing around a few weeks ago and I came across some data that people might be interested in. I’m not sure how far this blog will go, but I decided to post some findings.

Basically, I found a government website, cited below, that catalogs motor vehicle accidents.  I had trouble visualizing the data just from the spreadsheets that they had posted, so I graphed my own along with a repeated measures ANOVA to see if any trends were statistically significant.

This first graph shows the number of motor vehicle related deaths from 1994 to 2007.


Turns out that, when taking into account the number of miles driven, the number of motor vehicle fatalities has been declining for years. This trend is statistically significant, at F(6.623, 337.79)=41.5, p<.001 (if anyone is interested).

But what does that mean for the gross number of fatalities? Are we driving more? Or are we driving safer?

I found the raw statistics for the number of motor vehicle fatalities from 1994 to 2007. Turns out, people are just driving more -with the number of raw deaths diluted by a larger increase in miles driven in the graph above.

The straight number of deaths actually hasn’t changed significantly over the last 14 years, but there were a lot of non-significant trends. It doesn’t really look like that trend is toward a decrease, either. F(1.71, 87.216)=2.742, p=0.078.

The last data point (2007) on the graph is a bit of an outlier, and I’m still trying to figure out if this is because of oil prices, or an increase in alternative transportation, or what. Whatever the case is, the drop from 2005/2006 to 2007 is pretty incredible, and I’m hoping that 2005/2006 is a peak we never have to return to.


It’s actually pretty cool, because it looks 2007  returned us to 1994 levels, and apparently we’re driving more. I’d be curious to see if that drop in 2007 is due to more bikers. I’ll report back later.

All data were taken from http://www-fars.nhtsa.dot.gov/States/StatesFatalitiesFatalityRates.aspx

  Raw number of US Motor vehicle Fatalities